|
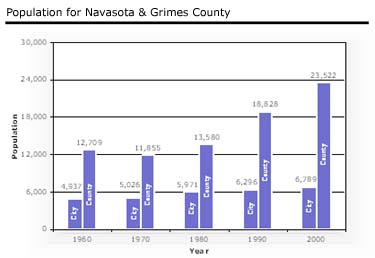
The population of the City of Navasota was 6,789 in 2000 based on the U.S. Census Bureau population data.
 This figure represents a 7.3% increase from the 1990 U.S. Census, following a generally slow, but steady population increase over the last fifty years. Navasota accounted for 28.8% of Grimes County’s population, a decrease from 33.4% in 1990. This trend has been persistent for the previous forty years. The population can be primarily found in households, with 6,572 people residing in 2,379 households in 2000. These figures yield an average of 2.76 persons per household within the city limits. This figure represents a 7.3% increase from the 1990 U.S. Census, following a generally slow, but steady population increase over the last fifty years. Navasota accounted for 28.8% of Grimes County’s population, a decrease from 33.4% in 1990. This trend has been persistent for the previous forty years. The population can be primarily found in households, with 6,572 people residing in 2,379 households in 2000. These figures yield an average of 2.76 persons per household within the city limits.
Although the current population for Navasota is difficult to assess, the population is estimated to be 7,100 persons in 2005. The figure above is based on the Texas State Data Center’s population projection for Grimes County for 2005,
 and assumes that Navasota will account for approximately 30% of Grimes County’s population. and assumes that Navasota will account for approximately 30% of Grimes County’s population.
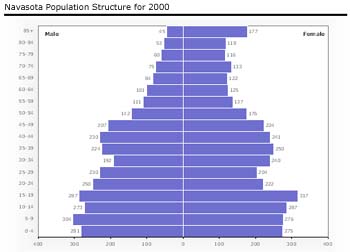
The population structure of Navasota is generally young with median ages for males and females at 28.9 and 35, respectively. Over half (51.6%) of the city’s population is within the ages of 20 to 64, and a third (33.8%) is under the age of 20. The number of females outnumber males in Navasota, with the population of males at 3,149 and females at 3,640. This difference in population by gender can be seen primarily in the older age cohorts; the number of females over the age of 65 is twice that of males. A detailed age structure can be seen in the population pyramid, based on 2000 U.S. Census data.
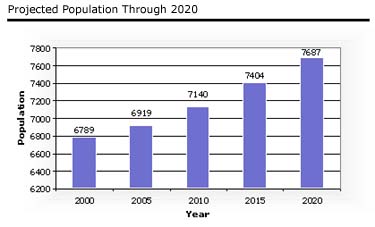
 The population of Navasota has been growing at a slow, but steady pace over the past 50 years. This trend is expected to continue through the foreseeable future. Population projections for the City of Navasota are shown in the Figure to the right. The population growth trend was projected through the year 2020 using national averages for birth and death rates and the current Navasota population profile. This projection assumes an immigration rate of zero. The calculated population profile closely follows historic trends.
For more demographic and workforce information, see the following excerpts from the Navasota Comprehensive Plan.

Section 5: Economic Base
| 
.pdf
|
Section 6: Demographics | 
.pdf
|
Section 16: Future Demographics
 | 
.pdf

|
|

